|

Allentown
Metro Market - Data collected March 2002
Buffalo Metro Market -
Data collected January 2002
Philadelphia Metro Market - Data collected January 2000
(Please call)

| Radio
signal measurements like youve never seen them
before. View the true radio signal characteristics
over geography in brilliantly colored contour plots,
examine signal statistics over a specified region,
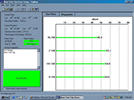
or observe bar graphs detailing the signal strength
from multiple radio transmitters in a region. Most
of all, each service package includes a comprehensive
survey report written by our Certified Professional
Broadcast Engineer detailing the results of the
survey. |
RGI’s
Mobile Signal Measurement System - GPS and Signal
Strength Data are Accurately Recorded |

RGI has developed the one-of-a-kind Radio Signal Surveying
System (RS3), a proprietary signal measurement system.
This versatile signal measuring system combines the
robust signal measuring capabilities of our state-of-the-art
mobile signal measuring system with global positioning
technology (GPS) and integrates them into a portable
system. RGI has created a turn-key integration package
which allows true signal measurements to be coupled
with a location information, thereby yielding results
that far surpass those of any other radio signal measuring
system or signal analysis tool.
RS3
provides both real-time and off-line signal analysis
and filter processing features. Once processed, the
signal data can be viewed in numerous graphical formats.
 |
Contour
Plots:
Vivid color plots displaying signal values over
selected regions of geography, can be used to
show holes in coverage, and provide information
on relevant signal anomalies.
|
|
Area
Analysis:
Displays signal statistics over a selected region
of measurements.
|
|
Point-By-Point
Analysis:
Displays the actual measurement values taken at
each measurement location.
|
Furthermore,
RGI has recently integrated mapping software into its
field strength data acquisition system. Now, RGI
can provide signal plots super-imposed over maps of
selected roadways, thereby delivering customers with
unsurpassed, radio signal information.
Example Contour Plots Showing Signal Strength Quality
over Geography:
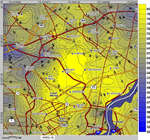
PHILADELPHIA
METRO MARKET
WRGI operating at Roxborough Site - 10 Mile Radius
|
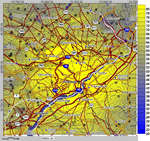 PHILADELPHIA
METRO MARKET
PHILADELPHIA
METRO MARKET
WRGI operating at Roxborough Site - 30 Mile Radius |

RGI’s
radio signal measurement service is essential to broadcasters
who want to know the true quality of radio signals throughout
their desired markets. Since RGI develops and integrates
its own data acquisition equipment, RGI can provide custom
plots and charts to show specific signal anomalies (available
upon customer request).
Broadcasters can use this service for the following:
|
To
identify "holes" in coverage area, possibly
caused by improper antenna orientation.
|
|
To
evaluate comparative coverage of other broadcasters
in the area.
|
|
To
compare the advantages and disadvantages of different
transmitter sites.
|
|
To
verify the real performance of power increases,
directional antennas, and other facility changes. |
RGI’s
high-precision measuring system captures true signal
strengths and processes it to provide customers with
unsurpassed signal information. The advantages of using
RS3 over conventional techniques is described below:
|
Shows
attenuation caused by trees and buildings, many
models do not.
|
|
Shows
actual "ground level" coverage (where
listeners are), aircraft measurements do not.
|
|
Use
the same antenna used by most radio listeners
(i.e., vertically polarized whip found on most
cars).
|
|
Shows
pattern distortion caused by side mounting of transmit
antenna, FCC contour predictions do not.
|
RGI
understands the needs of its customers -- they require
reliable, easy to read data from which to base their
decisions. RGI exceeds customer requirements by providing
custom signal strength plots that let customers graphically
view results describing the true coverage areas of their
single and multiple transmitting sites.
Simply put, RGI provides the BEST radio signal surveying
services globally, and RGI’s surveys are accurate,
comprehensive, and delivered in an easily understood
format.

RGI
offers its Radio Signal Surveying Service to radio broadcasters
who are interested in the true signal quality in any
desired market. RGI’s Radio Signal Surveying Service
is appropriate for FM, AM / HAR’s, HDTV, Mobile
Radio, Cellular, PCS, and Paging operators. In addition,
RGI offers its complete turn-key Radio Signal Surveying
System to broadcasters who want to perform their own
field surveying. Listed below are just a few of our
surveying packages:
|
PACKAGE
|
DESCRIPTION
|
|
A
|
Survey
of primary HDTV station - Includes drive of 1,000
miles |
|
B
|
Survey
of one competitor HDTV station |
|
C
|
Survey
of primary HDTV station and three competitor stations |
|
D
|
Survey
of primary FM station - Includes drive of 850 miles |
|
E
|
Survey
of one secondary FM station |
|
F
|
Survey
of primary FM station and three secondary stations |
|
G
|
Survey
of FM translator |
|
H
|
Survey
of primary AM station - Includes drive of 850 miles |
|
I
|
Survey
of one secondary AM station |
|
J
|
Survey
of primary AM station and three secondary stations |
|
K
|
Survey
of one HAR site |
|
L
|
Survey
of three HAR sites |
For
price quote please contact Dennis Murphy at (610) 358-6065,
Ext #4 or send E-mail to rgi_quotes@emailias.com
|